Follow-up Imaging and Spectroscopy of Nova Sagittae 2026 (V488 Sge)
 x
x
Left Figure: Color composite image of Nova Sagittae 2026, taken with the CTK-II on 2 September 2026, in the B-, V-, and R- band. The image covers a FoV of 8.45' × 8.45'. The nova is marked in the image with a white arrow. North is up and east is on the left.
Right Figure: The total spectral range, covered by our FLECHAS spectra of Nova Sagittae 2026. The individual spectral orders of FLECHAS were combined and convolved to a spectral resolving power R~740. Several significantly Doppler-broadened emission lines are detected in the spectra of Nova Sagittae 2026. Beside the prominent emission lines of the Balmer series (Hα, Hβ, and Hγ), and the strong O I (7774) emission line, several emission lines of singly ionized iron are present in the nova's spectra, the strongest of them are Fe II (4924), Fe II (5018), and Fe II (5169). The telluric absorption bands of O2 (Fraunhofer A and B line) are labelled with blue letters.
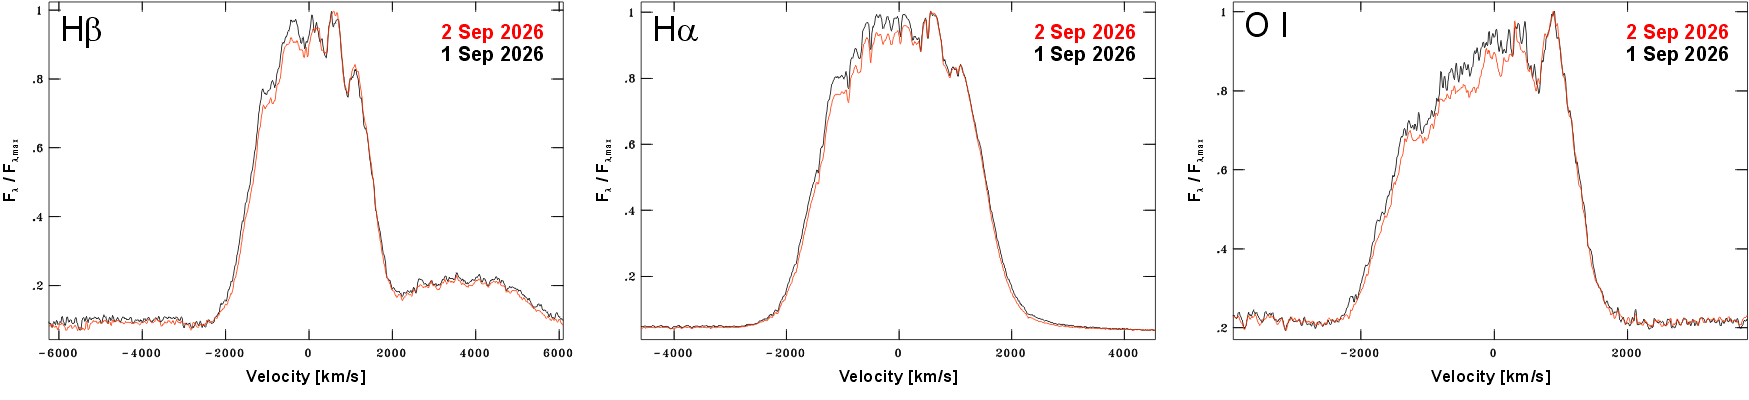
Figure: The line profiles of the three strongest emission lines, detected in the FLECHAS spectra of Nova Sagittae 2026. The lines have prominent absorption features in their line profiles and are significantly Doppler-broadened. On 1 September 2026 the line profiles have FWHM = 3000 ± 100 km/s, and FWHM = 2800 ± 100 km/s on 2 September 2026, respectively. This indicates the high expansion velocity (v ~ 1400 km/s) of the gas ejected during the nova explosion.